

Sustainable Development · The Road to 2030
With a decade of data now in, the world's shared blueprint has changed billions of lives — and is still on course to miss almost all of its 2030 targets. The gap between what works and what's funded has never been wider.
By Hub Culture Editorial · 16 September 2026
The Sustainable Development Goals were supposed to be the plan. In September 2015, all 193 UN member states signed up to 17 Goals, 169 targets and a 2030 deadline to end poverty, close the gender gap, decarbonise the economy and keep the peace. Four years out, the verdict from the UN's tenth annual stocktake is uncomfortably precise: the Goals work, but not fast enough to finish the job.
And yet the decade's gains are not abstractions. Internet access has jumped from 40% to 74% of humanity. Electricity now reaches 92% of the world, with renewable capacity per capita more than doubled since 2015. New HIV infections are down 30%, AIDS-related deaths have halved since 2010, and roughly a billion more people have safely managed drinking water. UN Secretary-General António Guterres calls the 2030 vision still "within reach" — but only with what he terms a "decisive final push."
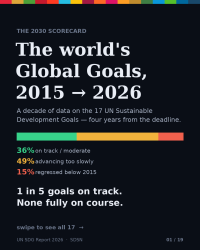
The 2030 Scorecard · UN Sustainable Development Goals
Four years left, and one goal in five is on track.
Where the 139 measurable targets stand, 2026
36% on track or moderate progress · 49% advancing too slowly · 15% regressed below 2015
Interactive (opens full screen): the 2030 scorecard. Each of the 17 Goals against its 2015 baseline — sortable best to worst. Source: UN SDG Report 2026 / SDSN.
The split screen — progress is now indicator-specific
What the aggregate scorecard hides is how goal-specific — even indicator-specific — progress has become. Health is the clearest case: child mortality has fallen from 44 to 37 deaths per 1,000, and the adolescent birth rate from 45.9 to 37.6 — while maternal mortality, at 197 deaths per 100,000, sits near three times its target. Two goals carry most of the good news. Connectivity (Goal 9) and clean energy (Goal 7) hold the five indicators closest to their 2030 marks: mobile broadband, internet use and electricity access.
The reversals cluster just as tightly. Adult obesity and unsustainable agriculture (Goal 2), press freedom and perceived corruption (Goal 16), and extinction risk (Goal 15) are the framework's worst-moving lines. Climate is the starkest: 2025 ran 1.43°C above pre-industrial levels, atmospheric CO₂ hit its highest concentration in two million years, and the number of people struck by climate-related disasters has more than doubled since 2015. Displacement has followed — 117.8 million people were forcibly displaced by the end of 2025, a level not seen in generations.
| Indicator | 2015 | Latest | Trend |
|---|---|---|---|
| Internet use (Goal 9) | 40% | 74% | ▲ |
| Access to electricity (Goal 7) | 87% | 92% | ▲ |
| Renewable capacity per capita (Goal 7) | ×1.0 | ×2.2 | ▲ |
| New HIV infections (Goal 3) | — | −30% | ▲ |
| Under-5 mortality, per 1,000 (Goal 3) | 44 | 37 | ▲ |
| Births with skilled attendant (Goal 3) | 80% | 87% | ▲ |
| Safely managed drinking water (Goal 6) | 68% | 74% | ▲ |
| Women in national parliaments (Goal 5) | 22.3% | 27.4% | ▲ |
| Extreme poverty, $3.00/day (Goal 1) | ~13% | ~10% | ▲ |
| Food insecurity, moderate/severe (Goal 2) | 1.6 bn | 2.3 bn | ▼ |
| Ocean designated as protected (Goal 14) | — | ~10% vs 30% target | ▶ |
| Forest cover, % of land (Goal 15) | 31.9% | 31.8% | ▼ |
| Global temperature vs pre-industrial (Goal 13) | ~1.0°C | 1.43°C | ▼ |
| People forcibly displaced (Goal 16) | ~65 M | 117.8 M | ▼ |
| Official development assistance (Goal 17) | 2015 level | −23.1% (2025) | ▼ |
▲ improving · ▶ stalled · ▼ worsening. Full indicator-by-indicator detail in the interactive report below.
The financing squeeze — the plumbing beneath every Goal
For a network built around the future economy, the most consequential story sits in Goal 17 — the plumbing beneath all the others. Official development assistance fell a record 23.1% in 2025, the largest annual drop ever recorded, dragging aid back to 2015 levels, with a further cut projected for 2026. The external debt of low- and middle-income countries reached a record $8.9 trillion. The annual gap between what the Goals need and what they get now stands at roughly $4 trillion. The tools are arriving as the funding retreats.
That inversion is the defining tension of the last mile. The UN's own framing has shifted from ambition to triage: "scale up what works," in the words of UN DESA's Li Junhua. The evidence for what works is now unusually good — a decade ago, half the SDG indicators had no data at all; today a database of more than 3.2 million points covers nearly every one. The catch is that trend data remains thinnest exactly where progress is weakest — gender, cities, climate, peace — meaning the measured picture likely flatters the real one.
SDG Indicator Report · 2026
One layer down: every goal, broken into the numbers underneath it.
All 17 Goals opened into their underlying indicators — the 2015 starting value against the most recent reading, and the direction of travel.
1 2 3 4 5 6 7 8 9 10 11 12 13 14 15 16 17
Interactive deep dive (opens full screen): all 17 Goals opened into their underlying indicators, with 2015 baselines, latest readings and trend. Source: UN SDG Report 2026, Extended Report and per-goal statistics; SDSN Sustainable Development Report 2026.
With COP31 approaching and the 2030 clock running down, the question is no longer whether the Goals can move the needle. The decade proves they can. It is whether the capital, cooperation and political will can be marshalled fast enough to scale the wins — clean energy, connectivity, disease control — before the reversals define the record. Four years is not long. But as the data shows, four years of the right push has changed the world before.
Sources: The Sustainable Development Goals Report 2026 and its Extended Report and per-goal statistics (UN DESA / UN Statistics Division, July 2026); the Secretary-General's Progress towards the Sustainable Development Goals 2026; and the Sustainable Development Report 2026 (SDSN / Sachs et al.). Figures reflect the most recent UN readings where editions differ.


