

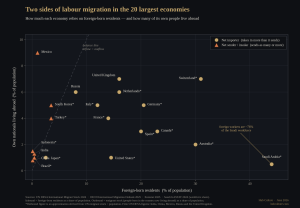
Global mobility has sat at the centre of how Hub Culture has read the world since 2002 — the premise that talent, identity and value increasingly move across borders rather than staying put. To put numbers to that intuition, we plotted the twenty largest economies along two axes: the share of each country’s population that is foreign-born, and the share of its own population now living abroad. The picture sorts the world’s major economies into four distinct groups.
The Dream State
One economy sits in a category of its own. In Saudi Arabia, foreign nationals make up roughly three-quarters of the workforce — about 13.2 million of 17.2 million workers in 2024 — and around 44% of the total population. No other major economy comes close to that level of structural dependence on imported labour. It is, in effect, an economy built on mobility.
The High Achievers
A second group — Switzerland, Australia and Canada — relies on foreign-born residents for roughly a quarter to a third of its population, with the large Western European economies and the United States clustering between about 12% and 20%. Across the OECD as a whole, more than 160 million residents were foreign-born in 2024, a share that rose from 9.1% to 11.5% over the previous decade. In labour-market terms the reliance is often higher still: in the United States the foreign-born are closer to a fifth of the workforce than the roughly 14.5% they represent of the population.
The Inward Giants
The most striking finding concerns the giant-population economies — China, India, Indonesia and Brazil — which sit together in the lower corner of the chart. They are at once the world’s largest absolute sources of people living abroad and among the lowest in percentage terms, while taking in almost no foreign labour. India is the single largest country of origin, with 18.5 million people abroad, followed by China with 11.7 million and Mexico with 11.6 million. Yet 18.5 million Indians is only about 1.3% of India’s population, and China’s 11.7 million barely 0.8%. At that scale, these are effectively self-contained labour markets.
Senders vs. Balancers
At the opposite end, Mexico is the clearest net sender among large economies: its 11.6 million emigrants equal close to 9% of its population — overwhelmingly in the United States — against a foreign-born share at home of roughly 1%. Russia and South Korea sit nearer the balance line, sending and receiving in broadly similar proportion. The United Kingdom is a revealing hybrid: a high-immigration economy that is also one of the developed world’s larger senders, with about 4.8 million Britons living abroad.
The wider lesson is one of proportion. Outside the Gulf, the scale of cross-border labour is more modest than the political temperature often implies: worldwide, international migrant workers numbered about 167.7 million in 2022, or 4.7% of the global labour force. Saudi Arabia stands out precisely because it sits so far from that norm — while the economies that dominate the migration debate are, for the most part, gathered within a fairly narrow band.
Who actually moves: the knowledge-economy profile?
The map above counts people. But the archetype that networks like Hub Culture are built around — the degree-holding knowledge worker, the corporate professional, the founder — is a minority of that count, even in the wealthiest destinations. In the United States, the most favourable case, foreign-born workers are slightly under-represented in white-collar work: about 37% are in management and professional occupations, against 45% of the native-born, and roughly 40% hold a bachelor’s degree or higher. By a reasonable estimate, only around one in six clears a six-figure salary.
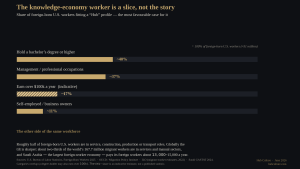
The wider migrant-worker map tilts much further toward lower-wage labour. Of some 167.7 million migrant workers worldwide, the services sector alone employs about two-thirds, concentrated in care, domestic work, hospitality, construction and agriculture. Saudi Arabia, the single largest foreign-worker economy, pays its foreign workers on the order of $13,000 to $15,000 a year. The professional, six-figure, internationally mobile profile is a thin slice of that whole.
Yet that slice is economically outsized. The foreign-born workforce is bimodal — it staffs the lowest-paid jobs while increasingly dominating the very top: the foreign-born share of U.S. earners above the 99th income percentile rose by nearly half between 2005 and 2019. Counted by heads, the knowledge-economy migrant is a minority; weighted by output, taxes, company formation and patents, that same minority carries disproportionate weight. The distinction — between the migration map measured by headcount and the one measured by value — is the more meaningful of the two.
Methodology and sources
Inbound figures measure foreign-born residents as a share of population, drawn from UN DESA’s International Migrant Stock 2024, the OECD’s International Migration Outlook 2025, and Eurostat (2025), with Saudi Arabia’s workforce share from GASTAT (2024). Outbound figures measure emigrant stock — people born in a country and now living abroad — as a share of population. Firm UN DESA figures are used for India, China, Mexico, Russia and the United Kingdom; figures for the other advanced economies are approximations derived from UN emigrant stock divided by population and should be read as indicative rather than exact. “Diaspora” totals reported elsewhere are frequently ancestry-based and are deliberately not used here. The companion chart on the knowledge-economy profile draws on US Bureau of Labor Statistics data (Foreign-Born Workers, 2025), OECD and Migration Policy Institute education statistics, ILO migrant-worker estimates (2022) and Saudi GASTAT (2024); the share of foreign-born workers earning over $100,000 is an indicative estimate triangulated from US earnings distributions, not a single published figure.
______________________


